AI for research: inspect data, calculations and evidence.
Analyze a CSV, reproduce descriptive statistics and explore a small resource-allocation model. Keep the observations, calculations and assumptions available to inspect as you develop the analysis.
The means are 15 minutes for A and 25 for B, a descriptive difference of 10 minutes in these four observations. Without assignment and context, that difference does not establish why it occurred.
Your follow-up
What information would make the next analysis more useful?
Arya
Ask how requests entered each group, when times were measured, which request types were included and what other factors could affect response time. Define the population before generalizing.
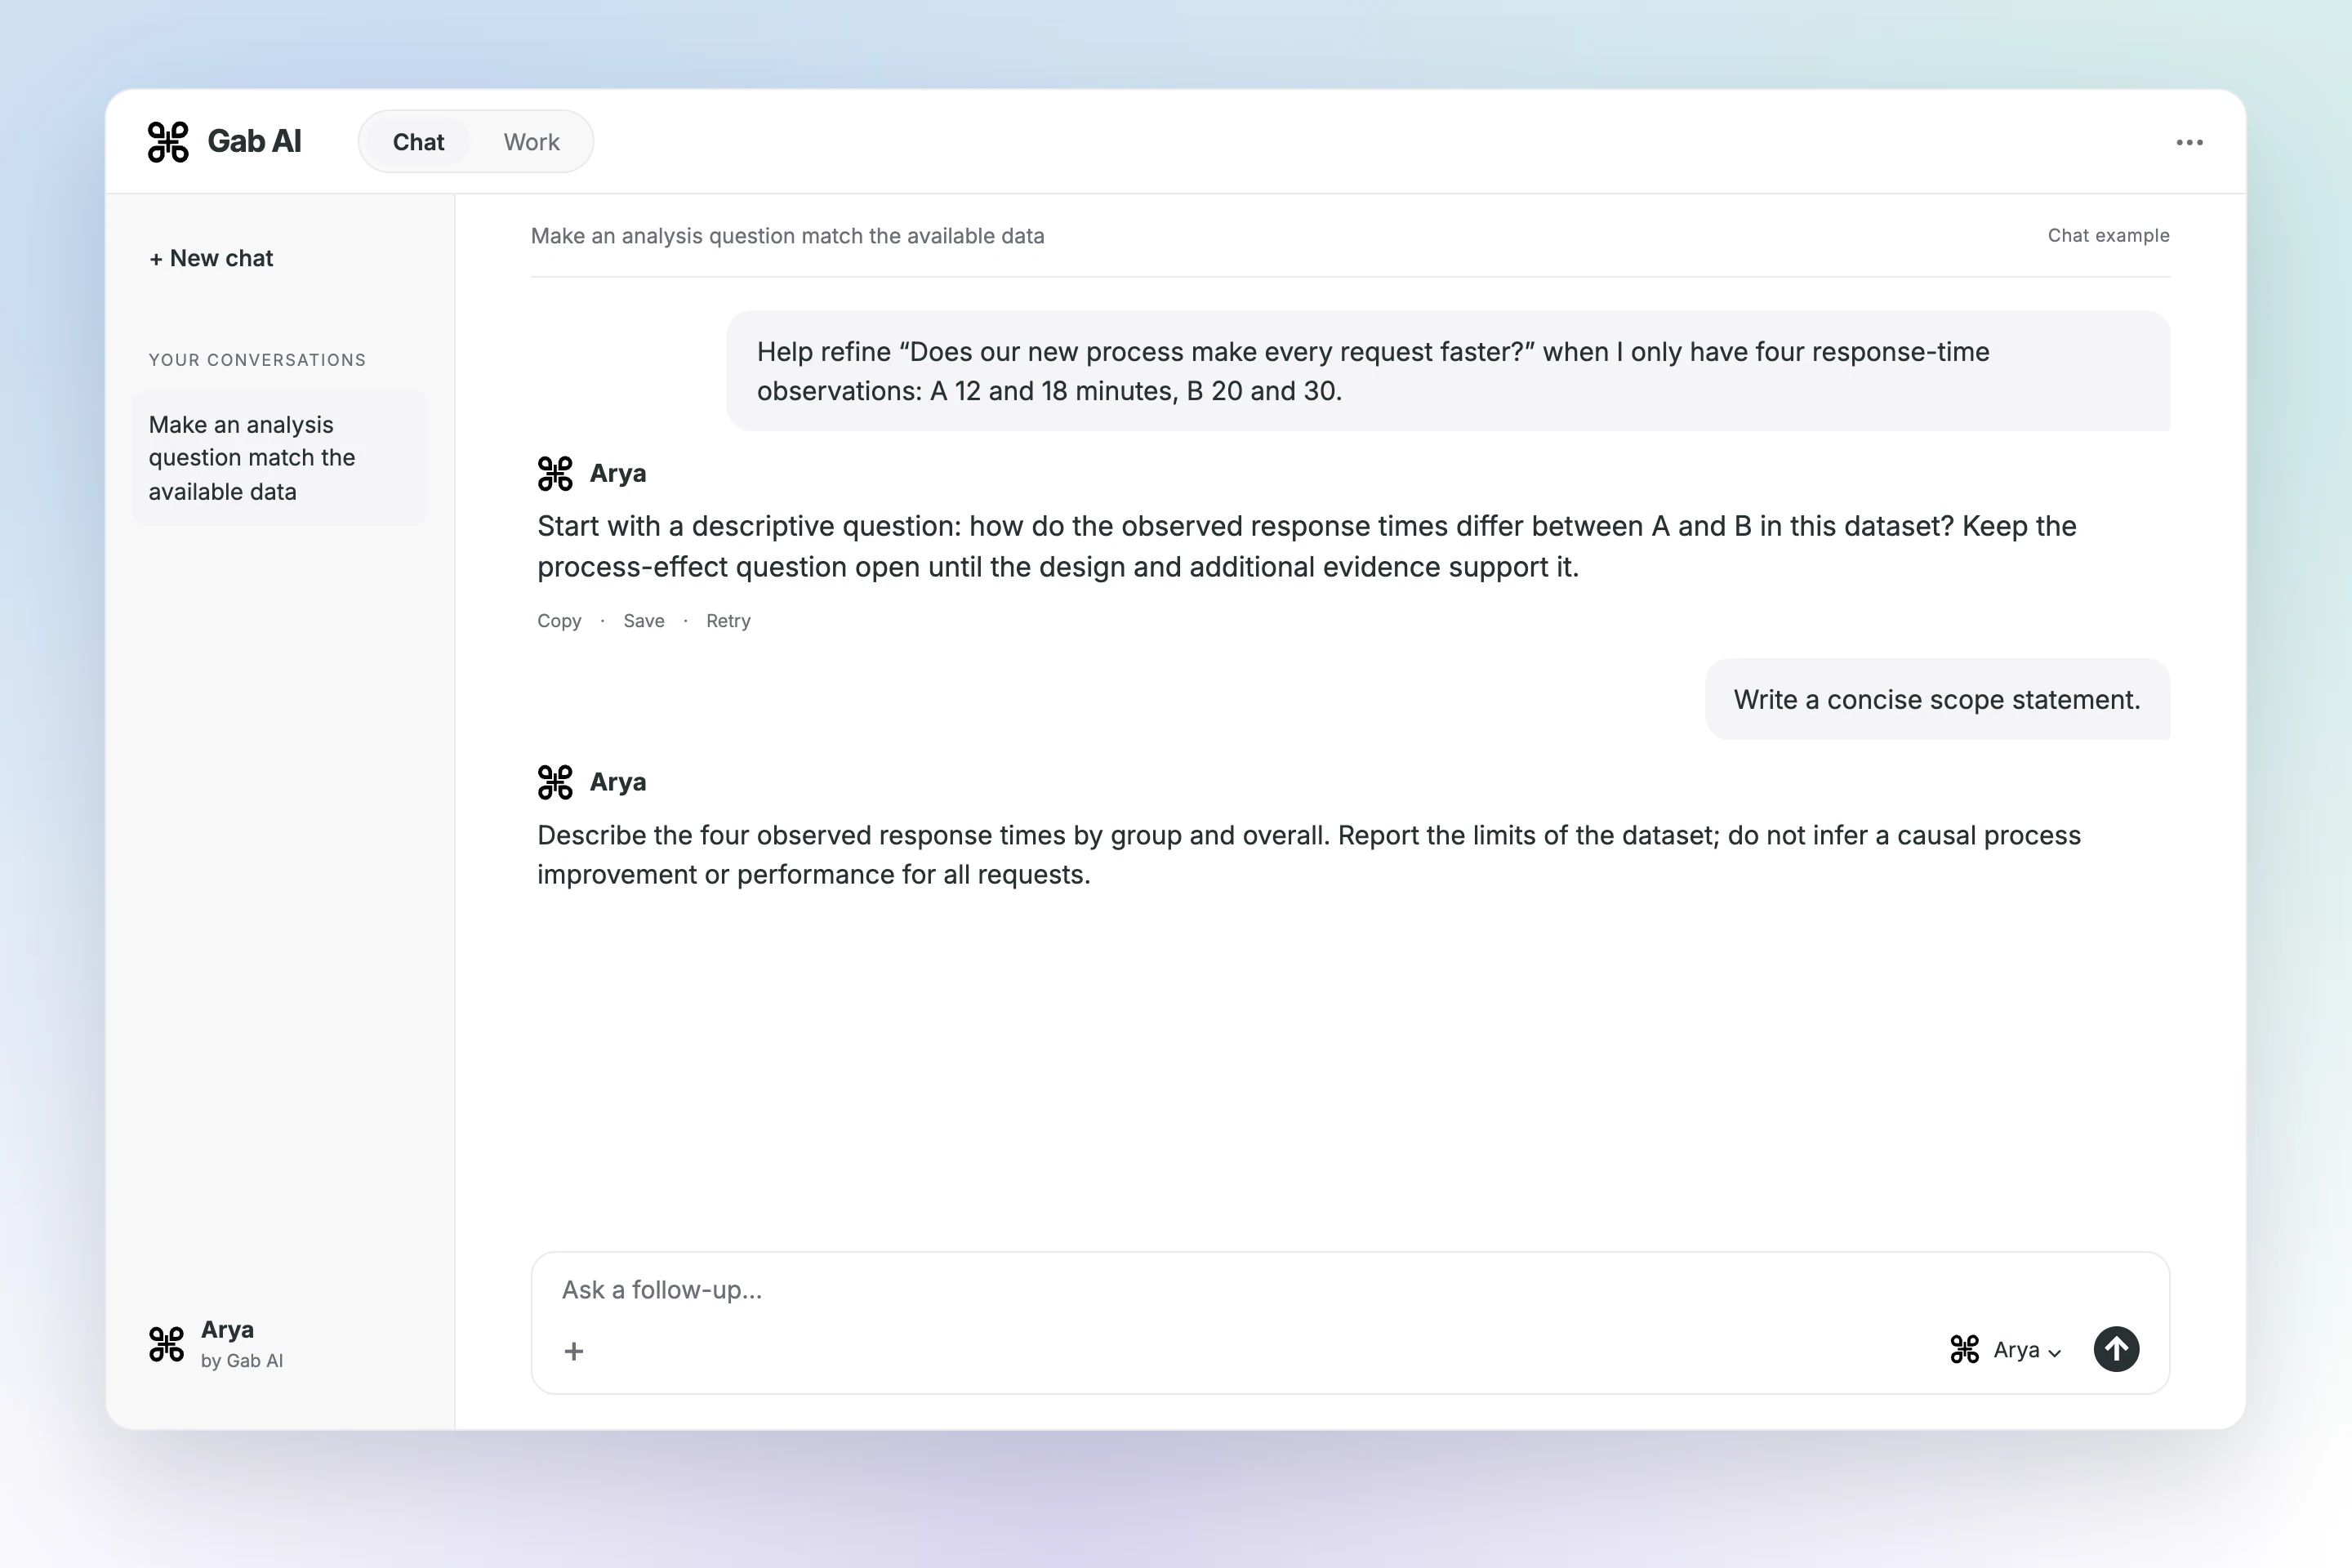
Make an analysis question match the available data
Start with a descriptive question: how do the observed response times differ between A and B in this dataset?
Start with a descriptive question: how do the observed response times differ between A and B in this dataset? Keep the process-effect question open until the design and additional evidence support it.
Your follow-up
Write a concise scope statement.
Arya
Describe the four observed response times by group and overall. Report the limits of the dataset; do not infer a causal process improvement or performance for all requests.
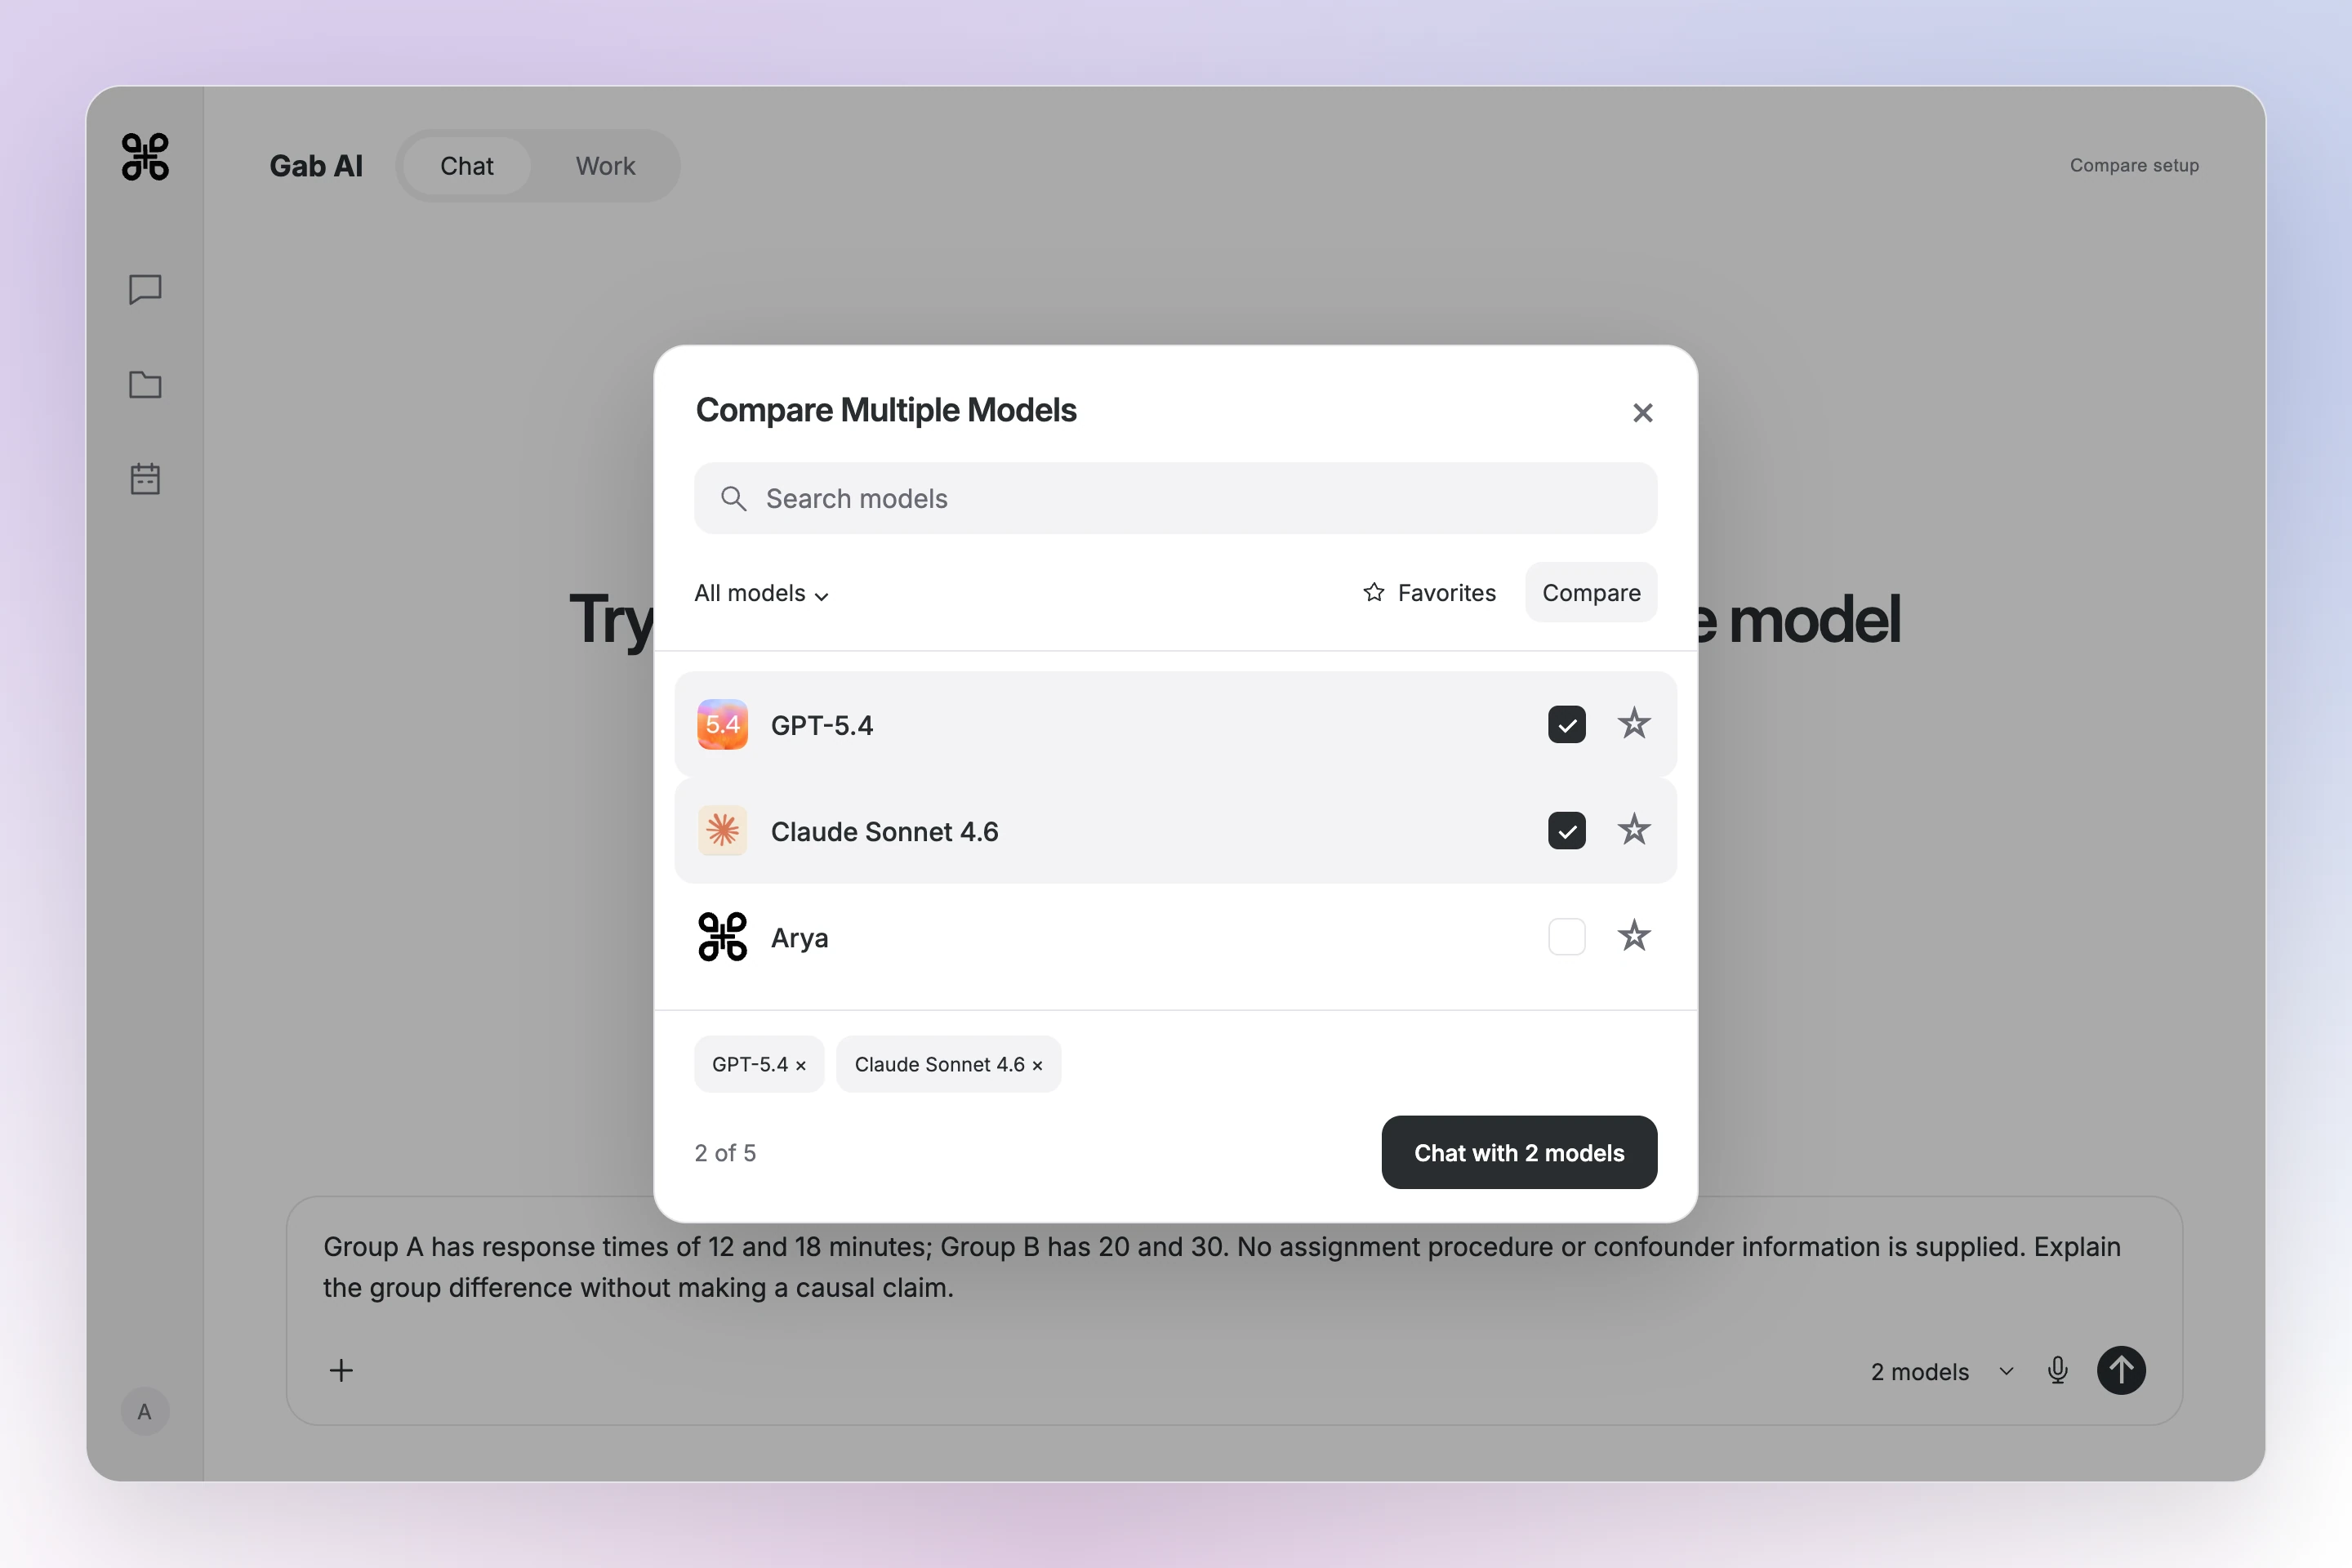
Try the same question with more than one model
Choose compatible models, compare their reasoning and decide which answer helps with your task.
In the model picker, turn on Compare and choose compatible models before sending the same prompt. Compare requires Plus; model access and credit use depend on the selection. Check facts and omissions rather than assuming a winner.
Calculate sample statistics and compare allocation options
Turn supplied data into checked descriptive results and reproducible analysis, then inspect a small allocation model with its assumptions in view.
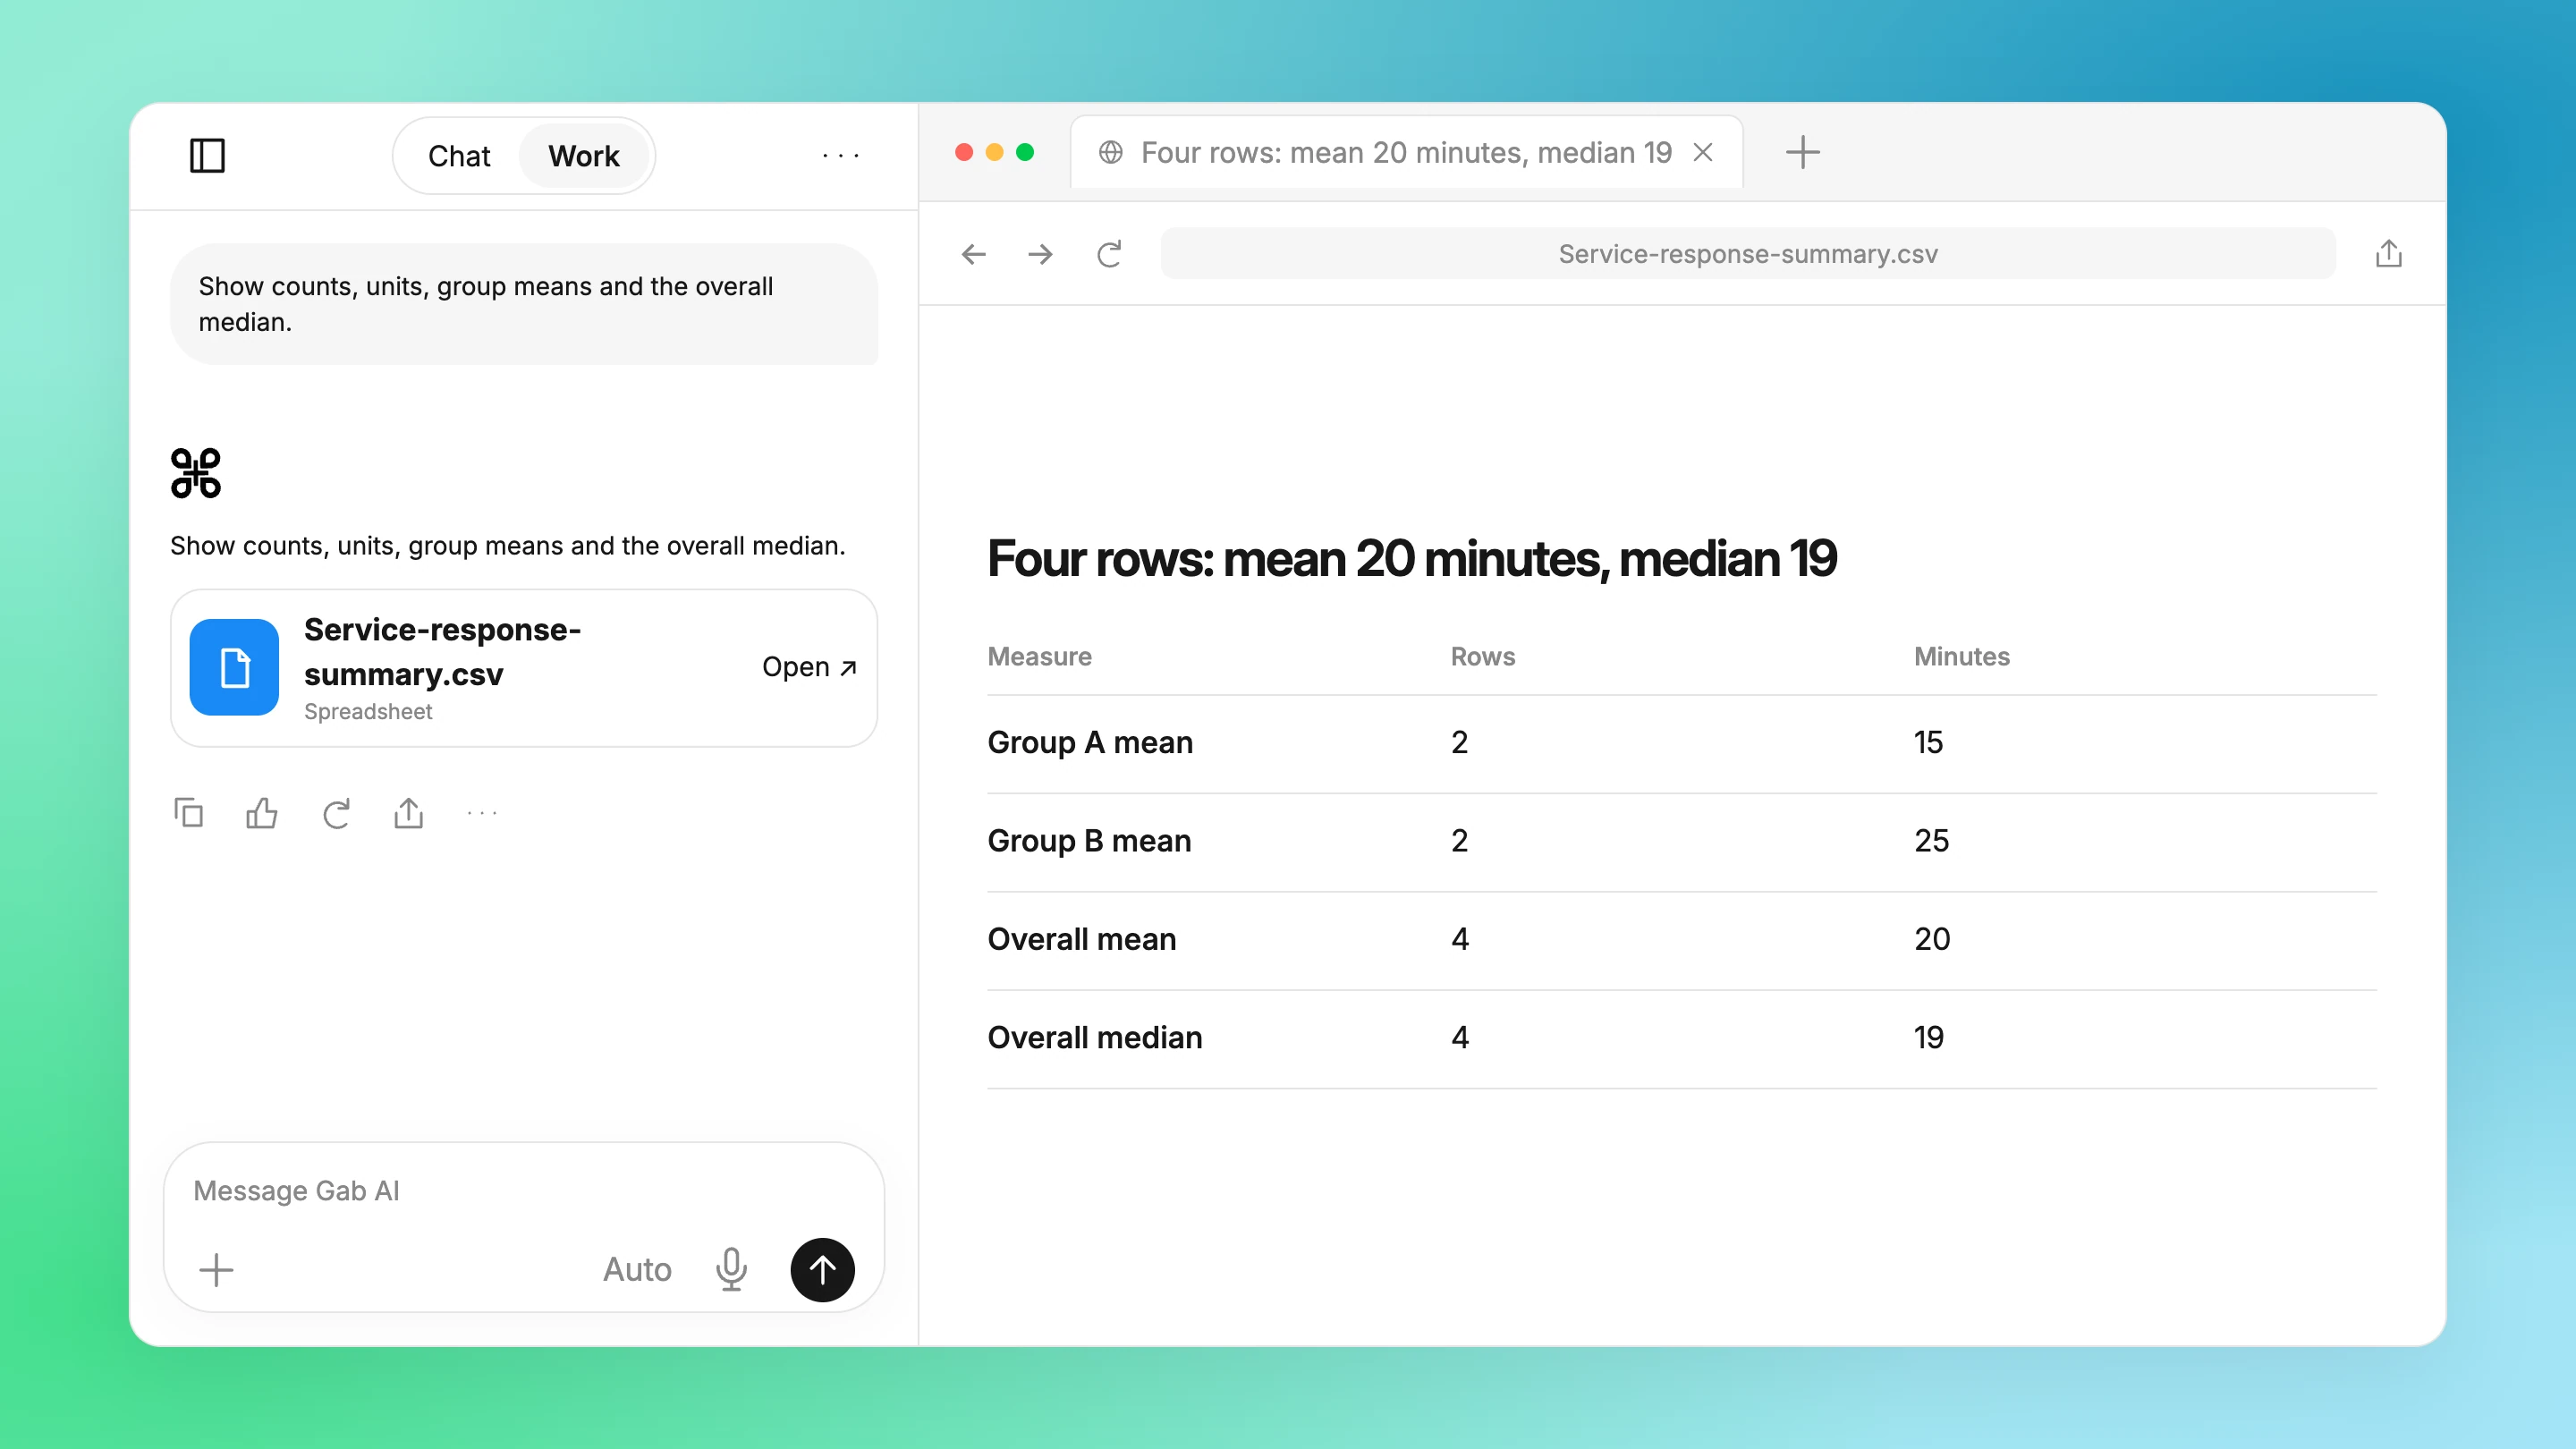
Summarize the service response sample
Show counts, units, group means and the overall median.
Group A: 12 and 18 minutes; mean 15. Group B: 20 and 30 minutes; mean 25. Overall mean 20; median (18 + 20) / 2 = 19. Only four purpose-created rows.
Inference boundary
No sampling frame, assignment procedure, uncertainty model or confounder information is supplied. A descriptive difference cannot establish a causal effect or generalize to all requests.
Service-analysis-question.txt
Analysis question
Summarize response time by group and overall. Show row counts, means and median; provide runnable JavaScript with explicit test checks. Explain why the sample does not establish a causal improvement.
Review requirements
Check all four inputs, arithmetic and calculations. Preserve units in minutes. Do not claim statistical significance, experimental treatment effects or a production operational recommendation.
Write the reproducible service response calculation
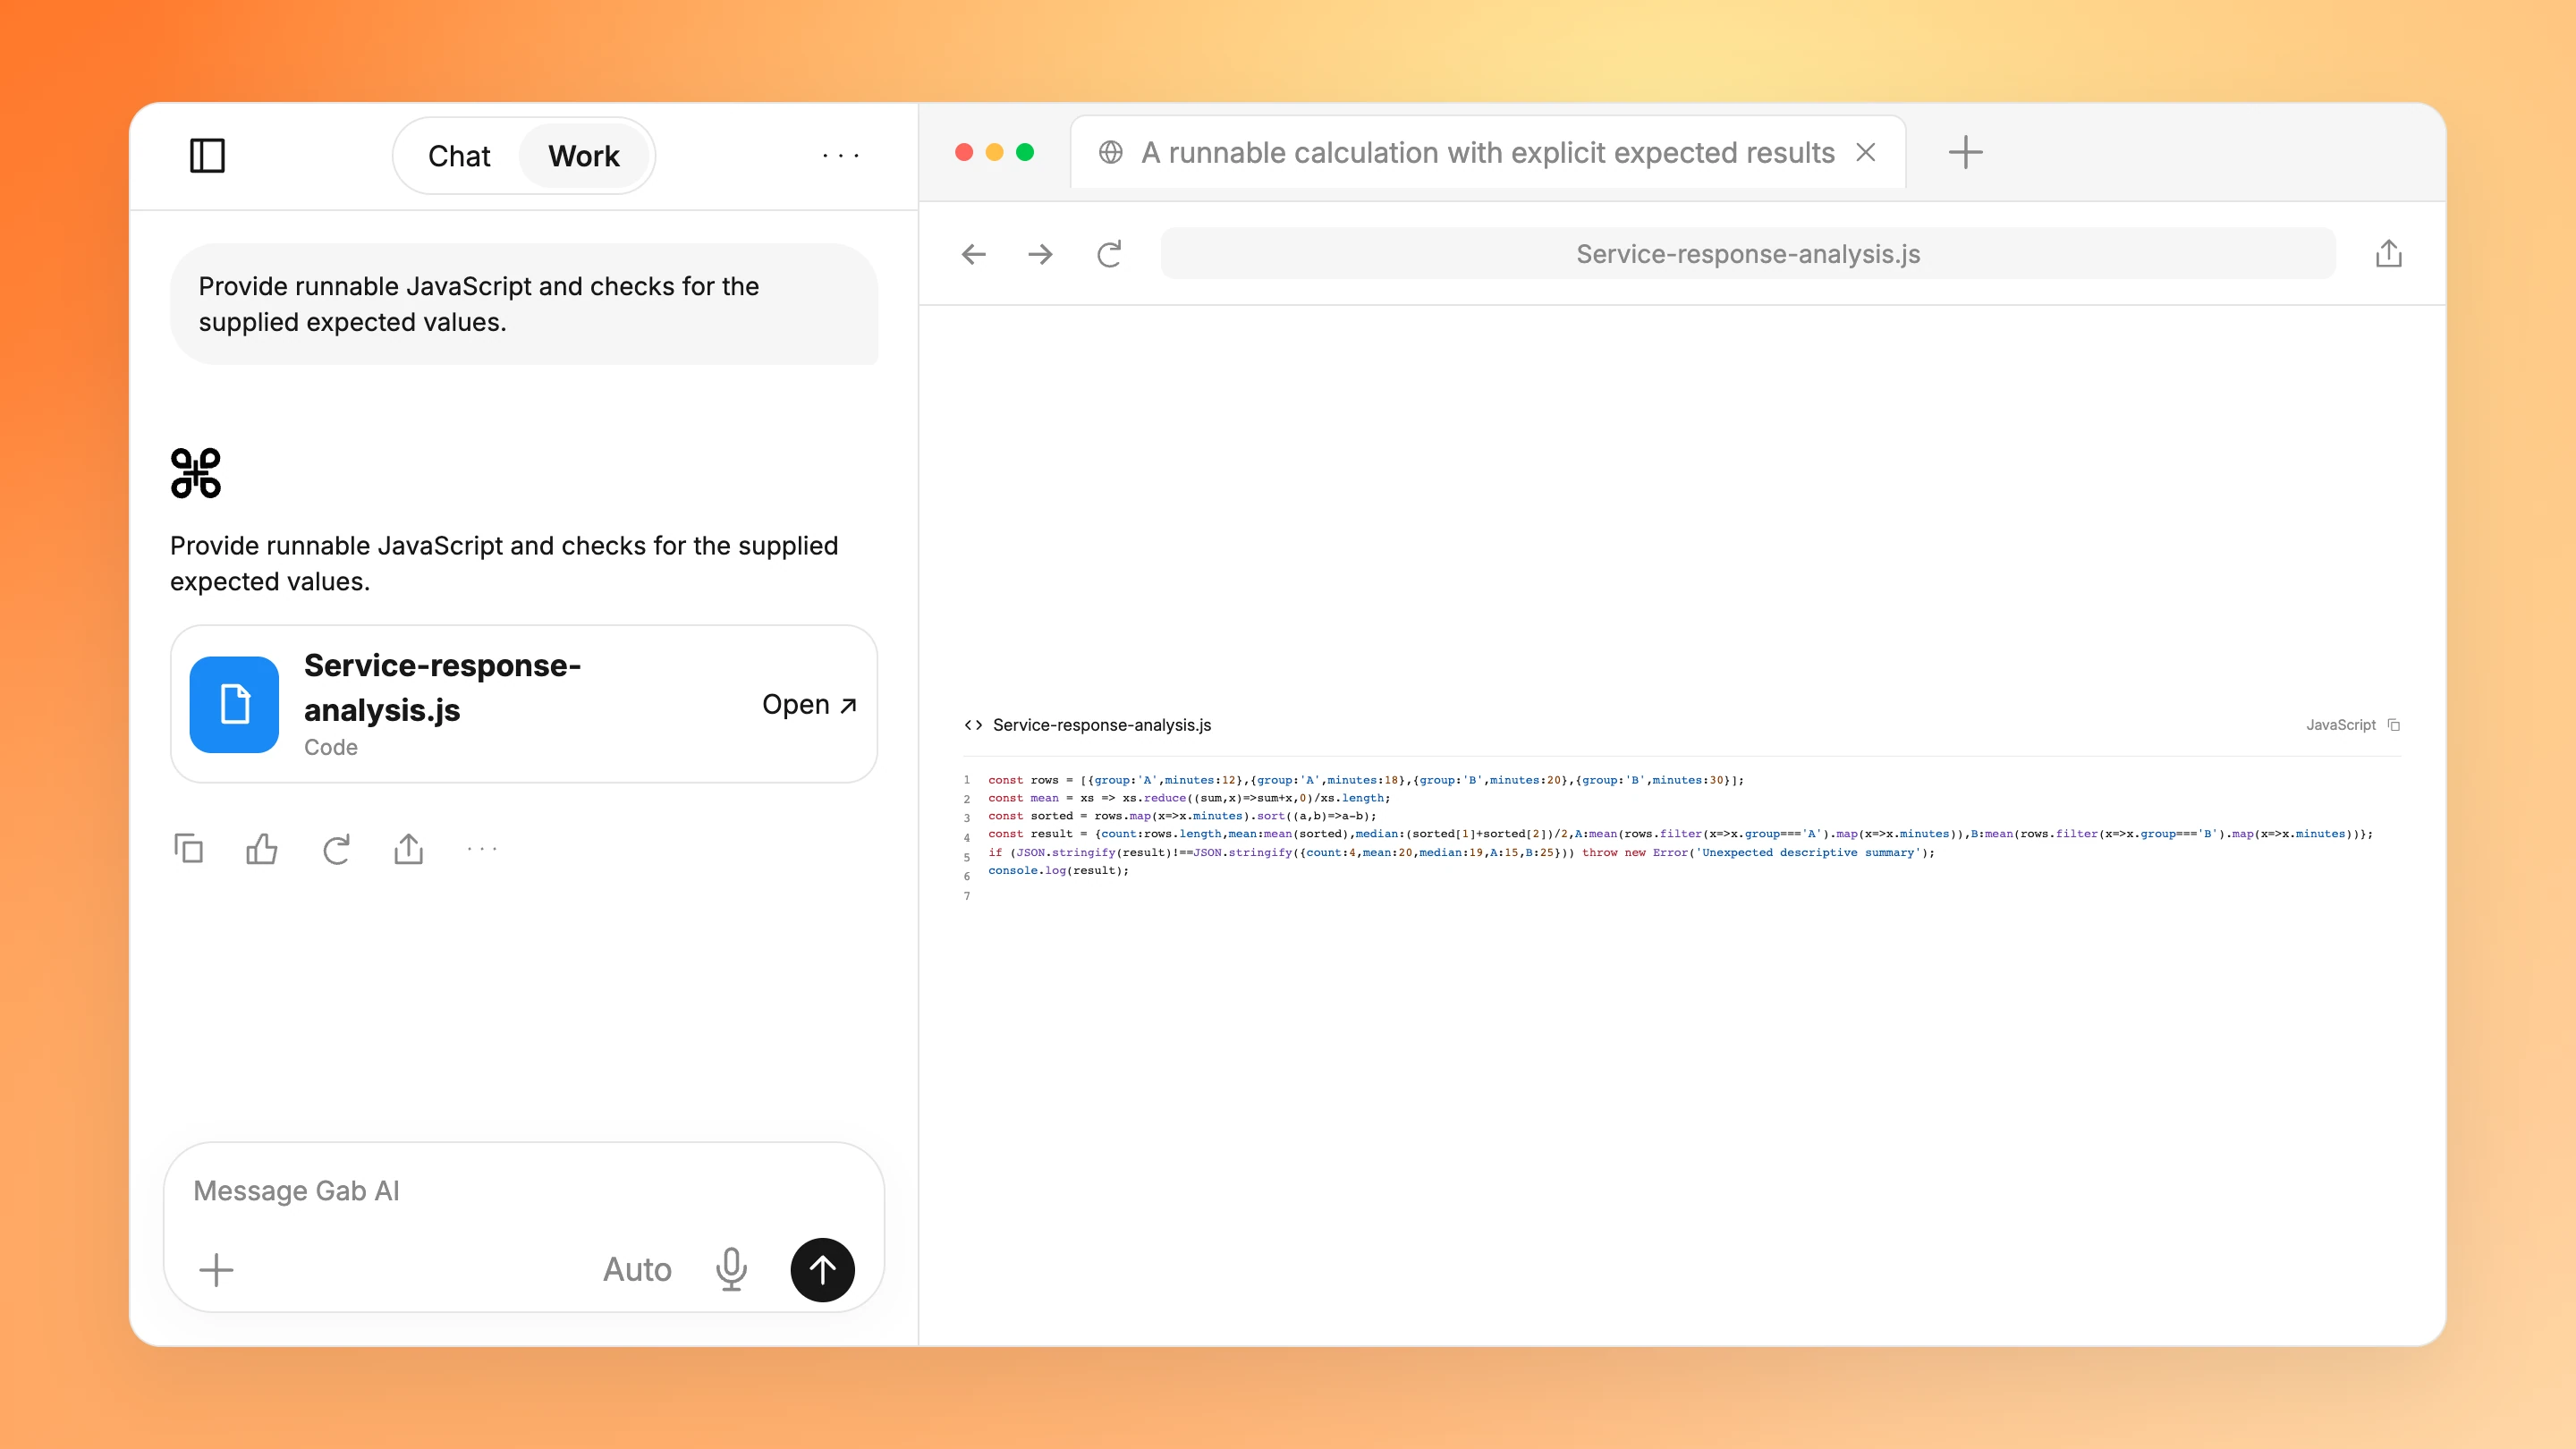
Provide runnable JavaScript and checks for the supplied expected values.
Group A: 12 and 18 minutes; mean 15. Group B: 20 and 30 minutes; mean 25. Overall mean 20; median (18 + 20) / 2 = 19. Only four purpose-created rows.
Inference boundary
No sampling frame, assignment procedure, uncertainty model or confounder information is supplied. A descriptive difference cannot establish a causal effect or generalize to all requests.
Service-analysis-question.txt
Analysis question
Summarize response time by group and overall. Show row counts, means and median; provide runnable JavaScript with explicit test checks. Explain why the sample does not establish a causal improvement.
Review requirements
Check all four inputs, arithmetic and calculations. Preserve units in minutes. Do not claim statistical significance, experimental treatment effects or a production operational recommendation.
Solve and inspect a small constrained allocation
Compare every allowed option, see which constraints bind and check a capacity scenario.
Inspect the feasible options. Reproduce the optimum.
About this example
Eight-hour baseline
Enumerating all twelve allowed count pairs leaves eight feasible pairs. A = 1 and B = 2 use eight staff hours and eleven material units and produce thirteen value points, the unique maximum among feasible pairs.
Resource-allocation-model.txt
Resource-allocation-options.csv
Ten-hour scenario
Assuming ten staff hours makes nine pairs feasible. A = 2 and B = 1 use ten staff hours and ten material units and produce fourteen value points. The extra hours are not confirmed resources.
Resource-allocation-model.txt
Resource-allocation-options.csv
What the optimum means
The enumerator proves a maximum only for the supplied integer counts, coefficients, constraints and value-point objective. The source does not establish the model’s real-world usefulness, uncertainty or fairness.
Resource-allocation-model.txt
Compare all twelve combinations and a capacity scenario. The result depends on the supplied model and inputs.
Read the prompt and inspect the full example
Compare every allowed option, see which constraints bind and check a capacity scenario.
Baseline capacity is eight staff hours and twelve material units. Option counts must be nonnegative integers. At most two units of A and three units of B may be chosen. Choosing zero of an option is permitted.
Objective and units
Maximize supplied value points, not money or a measured business outcome. Each A contributes five points and each B contributes four points. Staff hours and material units are separate constraints. There is no minimum-demand requirement, randomness, interaction benefit or causal interpretation in this model.
Explicit capacity scenario
For comparison only, consider ten staff hours while keeping twelve material units and the same option limits. Those two extra hours are an assumption, not confirmed availability. The scenario does not change the option values or material requirements.
Scope of the result
This is a twelve-combination toy model. Exhaustive enumeration can establish its optimum under these supplied deterministic assumptions. It does not establish a real-world allocation, statistical validity, fairness, future demand or the quality of the value-point assumptions. Review the formulation and resource data before using an optimization result.
Resource-allocation-options.csv
Option A coefficients
One unit of A needs four staff hours and three material units and contributes five value points. Its maximum count is two.
Option B coefficients
One unit of B needs two staff hours and four material units and contributes four value points. Its maximum count is three.
Independent verification targets
At baseline, A = 1 and B = 2 use eight staff hours and eleven material units for thirteen value points. With the ten-hour scenario, A = 2 and B = 1 use ten staff hours and ten material units for fourteen points. Enumerate every allowed count pair before calling either optimal.
About these examples
Summarize data and reproduce an analysis
Explore the sample deliverables, then open the workflow to inspect their inputs and evidence.
From the first question to useful work
Summarize the service response sample
Show counts, units, group means and the overall median.
Add the data, column definitions, units and research question before sending.
Read all source material
Service-response-sample.csv
Observed values
Group A: 12 and 18 minutes; mean 15. Group B: 20 and 30 minutes; mean 25. Overall mean 20; median (18 + 20) / 2 = 19. Only four purpose-created rows.
Inference boundary
No sampling frame, assignment procedure, uncertainty model or confounder information is supplied. A descriptive difference cannot establish a causal effect or generalize to all requests.
Service-analysis-question.txt
Analysis question
Summarize response time by group and overall. Show row counts, means and median; provide runnable JavaScript with explicit test checks. Explain why the sample does not establish a causal improvement.
Review requirements
Check all four inputs, arithmetic and calculations. Preserve units in minutes. Do not claim statistical significance, experimental treatment effects or a production operational recommendation.
Resource-allocation-model.txt
Baseline resource limits
Baseline capacity is eight staff hours and twelve material units. Option counts must be nonnegative integers. At most two units of A and three units of B may be chosen. Choosing zero of an option is permitted.
Objective and units
Maximize supplied value points, not money or a measured business outcome. Each A contributes five points and each B contributes four points. Staff hours and material units are separate constraints. There is no minimum-demand requirement, randomness, interaction benefit or causal interpretation in this model.
Explicit capacity scenario
For comparison only, consider ten staff hours while keeping twelve material units and the same option limits. Those two extra hours are an assumption, not confirmed availability. The scenario does not change the option values or material requirements.
Scope of the result
This is a twelve-combination toy model. Exhaustive enumeration can establish its optimum under these supplied deterministic assumptions. It does not establish a real-world allocation, statistical validity, fairness, future demand or the quality of the value-point assumptions. Review the formulation and resource data before using an optimization result.
Resource-allocation-options.csv
Option A coefficients
One unit of A needs four staff hours and three material units and contributes five value points. Its maximum count is two.
Option B coefficients
One unit of B needs two staff hours and four material units and contributes four value points. Its maximum count is three.
Independent verification targets
At baseline, A = 1 and B = 2 use eight staff hours and eleven material units for thirteen value points. With the ten-hour scenario, A = 2 and B = 1 use ten staff hours and ten material units for fourteen points. Enumerate every allowed count pair before calling either optimal.
Prepare a data summary
Show counts, units, group means and the overall median.
Refine analytical conclusions against the inputs
Compare the draft with a focused revision, keeping the source facts in view.
Try one focused revision
Suggested follow-up using the same source facts.
Focused follow-up
What change should I ask for?
Explain the allocation in plain language. Retain all twelve choices, eight feasible pairs, A=1/B=2, resource use and thirteen points; keep the scope to this supplied model.
Original excerpt
What does the existing example say?
Enumerating all twelve allowed count pairs leaves eight feasible pairs. A = 1 and B = 2 use eight staff hours and eleven material units and produce thirteen value points, the unique maximum among feasible pairs.
Suggested revision
What could that revision look like?
Of twelve allowed count pairs, eight meet the supplied limits. Choosing A = 1 and B = 2 uses eight staff hours and eleven material units for thirteen value points, the unique maximum among feasible pairs in this small model. It does not establish a generally best or fair real-world allocation.
Four observations for a descriptive analysis demonstration.
What are the group means and overall median?
Observed values Group A: 12 and 18 minutes; mean 15. Group B: 20 and 30 minutes; mean 25. Overall mean 20; median (18 + 20) / 2 = 19. Only four purpose-created rows.
Does the group difference establish causation?
Inference boundary No sampling frame, assignment procedure, uncertainty model or confounder information is supplied. A descriptive difference cannot establish a causal effect or generalize to all requests.
Inspect the constraints and the boundary of the model.
Why choose one A and two B at baseline?
Binding resource They use 1 × 4 + 2 × 2 = 8 staff hours and 1 × 3 + 2 × 4 = 11 material units for 1 × 5 + 2 × 4 = 13 points. Every allowed pair is enumerated; no other baseline-feasible pair scores higher.
Do the fourteen points establish an improvement in actual operations?
Scenario boundary No. Fourteen points are the optimum only in the assumed ten-hour scenario with unchanged coefficients and limits. Availability, future outcomes and the usefulness of the objective have not been established.
Use Chat to discuss the request and refine the result with follow-up questions.
Deliverable: Question and inclusion criteria
What to provide
Your research aim, context and permitted scope
Example prompt
Help refine this research question into a clear scope and inclusion criteria. Identify ambiguous concepts and alternative explanations. Do not invent that a literature gap exists without checking the relevant sources.
What to check
Verify bibliographic details
Compare methods and definitions
Keep interpretation separate from findings
Work
Summarize the service response sample
A descriptive sample difference, not a causal result.
Use Work to create and revise the editable Service response summary.csv with the supplied source files.
Deliverable: Service-response-summary.csv
What to provide
Service-response-sample.csv: Four observations for a descriptive analysis demonstration.
Service-analysis-question.txt: A bounded question for reproducible file analysis.
Example prompt
Create Service-response-summary.csv from Service-response-sample.csv and Service-analysis-question.txt. Verify four rows, group means A 15 and B 25, overall mean 20 and median 19 minutes. Keep the summary descriptive.
What to check
Verify the inputs, code and scope of inference
Check the original source and unresolved assumptions
Review before publishing, spending or changing a plan
Work
Write the reproducible service response calculation
Use Work to create and revise the editable Service response analysis.js with the supplied source files.
Deliverable: Service-response-analysis.js
What to provide
Service-response-sample.csv: Four observations for a descriptive analysis demonstration.
Service-analysis-question.txt: A bounded question for reproducible file analysis.
Example prompt
Create Service-response-analysis.js from Service-response-sample.csv and Service-analysis-question.txt. Calculate counts, group means, overall mean and median. Include explicit expected-value checks. Preserve minutes and avoid causal or significance claims.
What to check
Verify the inputs, code and scope of inference
Check the original source and unresolved assumptions
Review before publishing, spending or changing a plan
Work
Solve and inspect a small constrained allocation
Compare every allowed option, see which constraints bind and check a capacity scenario.
Use Work to create and execute the named, inspectable model from the supplied source files.
Deliverable: Resource-allocation-model.html
What to provide
Resource-allocation-model.txt
Resource-allocation-options.csv
Example prompt
Create Resource-allocation-model.html from Resource-allocation-model.txt and Resource-allocation-options.csv. Build a self-contained interactive report that enumerates all twelve nonnegative integer count pairs within the supplied A and B limits. Show feasible and rejected combinations, resource use and the value-point objective. At eight staff hours and twelve material units, verify A = 1, B = 2 and thirteen points; compare the explicitly assumed ten-hour scenario, A = 2, B = 1 and fourteen points. Include runnable JavaScript and independent checks. Keep all units and assumptions visible. Do not treat value points as money, extra hours as confirmed availability, or this toy model as a validated real-world allocation.
What to check
Verify the model formulation and units
Reproduce the baseline and scenario checks
Replace sample coefficients only with reviewed data
More prompts
Chat
Compare two source studies
A source-linked study comparison making methodological differences and limitations visible.
Use Chat to discuss the request and refine the result with follow-up questions.
Deliverable: Study comparison
What to provide
The supplied papers and outcomes you want to compare
Example prompt
Compare these papers' methods, populations, outcome definitions and limitations. Cite document sections, distinguish reported results from interpretation and flag incompatible measures. Do not calculate pooled findings without adequate data.
What to check
Verify bibliographic details
Compare methods and definitions
Keep interpretation separate from findings
Work
Build a literature evidence workbook
A literature workbook with traceable extraction fields and separate inclusion or exclusion decisions.
Use Work to build and revise Literature evidence workbook.xlsx from your source material.
Deliverable: Literature evidence workbook.xlsx
What to provide
Source papers, inclusion criteria and extraction fields
Example prompt
Create a workbook recording citation, design, sample, measures, reported findings, limitations and source/page references. Keep excluded sources and reasons separately, preserve missing data and do not fabricate bibliographic details or findings. Deliver "Literature evidence workbook.xlsx" as the requested editable artifact. Ask for missing source material rather than inventing facts.
What to check
Verify bibliographic details
Compare methods and definitions
Keep interpretation separate from findings
Work
Create an editable research brief
A research document with source-linked conclusions, conflicting evidence and defined limits.
Use Work to build and revise Research brief.docx from your source material.
Deliverable: Research brief.docx
What to provide
Approved question, selected evidence and reporting audience
Example prompt
Create a brief explaining the research question, evidence, conflicting results and limitations using the supplied sources. Link conclusions to evidence and identify next research questions; do not imply causality or certainty beyond the study designs. Deliver "Research brief.docx" as the requested editable artifact. Ask for missing source material rather than inventing facts.
What to check
Verify bibliographic details
Compare methods and definitions
Keep interpretation separate from findings
Work
Build and test an analysis notebook
A reproducible notebook using the uploaded dataset with data validation, leakage checks, explicit train/test separation and appropriate evaluation plots.
Use Work to create and revise Analysis notebook and findings.zip alongside the conversation.
Deliverable: Analysis notebook and findings.zip
What to provide
Anonymized data schema, research question and permitted environment
Model assumptions, data splits and evaluation definitions
Example prompt
Create a reproducible notebook using the uploaded dataset with data validation, leakage checks, explicit train/test separation and appropriate evaluation plots. Include a README and executed-test evidence where supported; do not invent results when data or computation is unavailable. Deliver an editable artifact named "Analysis notebook and findings.zip". If source material is missing, ask for it instead of filling factual gaps.
What to check
Inspect validation, leakage and train/test separation
Run the notebook in the permitted environment
Review metrics, assumptions and unresolved reproducibility limits
Work
Build and test a small optimization notebook
A reproducible optimization notebook for the supplied small problem with data validation, unit checks and explicit solver status.
Use Work to create and revise Optimization notebook and results.zip alongside the conversation.
Deliverable: Optimization notebook and results.zip
What to provide
Decision variables, units, objective and explicit constraints
Input dataset, model assumptions and solution criteria
Example prompt
Create a reproducible optimization notebook for the supplied small problem with data validation, unit checks and explicit solver status. Include a hand-checkable test case, infeasibility checks and sensitivity notes; do not claim optimality without solver evidence or invent results if execution is unavailable. Deliver an editable artifact named "Optimization notebook and results.zip". If source material is missing, ask for it instead of filling factual gaps.
What to check
Verify units, constraints and solver status
Recalculate the small test case against the notebook output
Document infeasible, unbounded or unverified solutions
Use Work to create and revise the editable Service response evidence note.docx with the supplied source files.
Deliverable: Service response evidence note.docx
What to provide
Service-response-sample.csv: Four observations for a descriptive analysis demonstration.
Service-analysis-question.txt: A bounded question for reproducible file analysis.
Example prompt
Create Service response evidence note.docx from Service-response-sample.csv and Service-analysis-question.txt. Summarize results and document missing sampling, assignment and confounder information. State why the difference does not establish causal improvement or population performance.
What to check
Verify the inputs, code and scope of inference
Check the original source and unresolved assumptions
Review before publishing, spending or changing a plan
Questions about research and reproducible analysis
Can Gab AI analyze data from my source files?
Give Work the files, column definitions, units and the question you want to answer. Ask for an inspectable result and runnable calculations. Check missing values, denominators and assumptions.
Can I reproduce the calculations in these examples?
Yes. The descriptive example includes a JavaScript calculation you can inspect with expected-value checks. The allocation example includes its enumerator in the completed HTML file.
Can Gab AI help with constrained resource allocation?
Specify variables, units, count limits, resource constraints and the objective; ask Work for reproducible checks and rejected options. In the toy model, twelve pairs yield eight feasible choices: A = 1 and B = 2 use eight staff hours and eleven material units for thirteen points. This does not validate a real organization’s objective, fairness or unrestricted optimum.
Does a descriptive sample difference establish a causal effect?
No. Check how observations were sampled, assigned and measured, and account for confounding and uncertainty. The service-response sample has four observations and does not establish causal improvement or population performance.
Can I build a literature evidence workbook too?
Use the literature-workbook prompt with the source papers, inclusion criteria and extraction fields. Verify every bibliographic detail and compare extracted claims with the actual papers. Keep inclusion decisions, findings and interpretation distinct.
Can I start in Chat, or do I need Work?
Use Chat for questions and text drafts. Choose Work when you want a project with tools and editable files. Work requires Plus and uses credits; see Pricing for plans and allowances. Opening a draft does not send it or attach the example files.